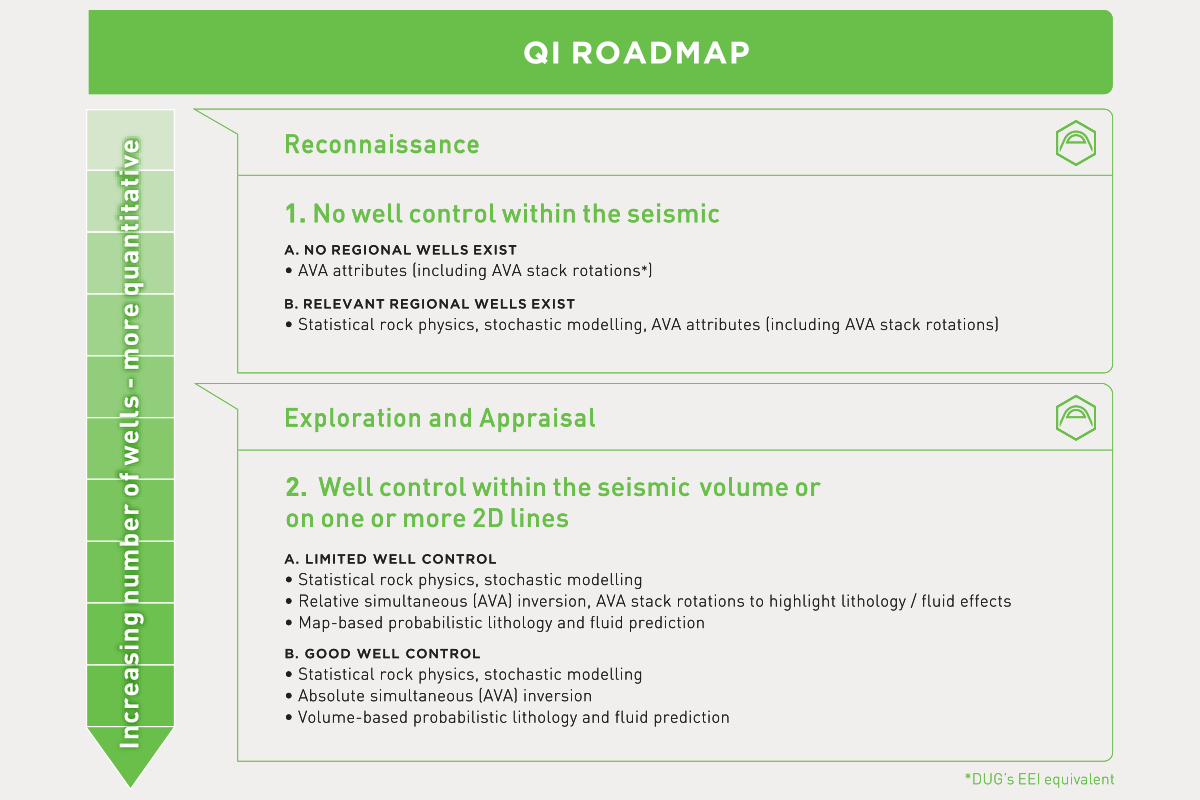
DUG offers two major product lines with respect to Quantitative Interpretation services. The different offerings are tailored to suit the amount and type of input data that is available and what study objectives are required to be met. Each of these products can be applied to both 2D and 3D seismic data.
Elastic properties are influenced by depositional environment (lithology type), fluid content and local geological trends (compaction/burial history).
A rock physics model should predict the elastic properties of a potential lithology:
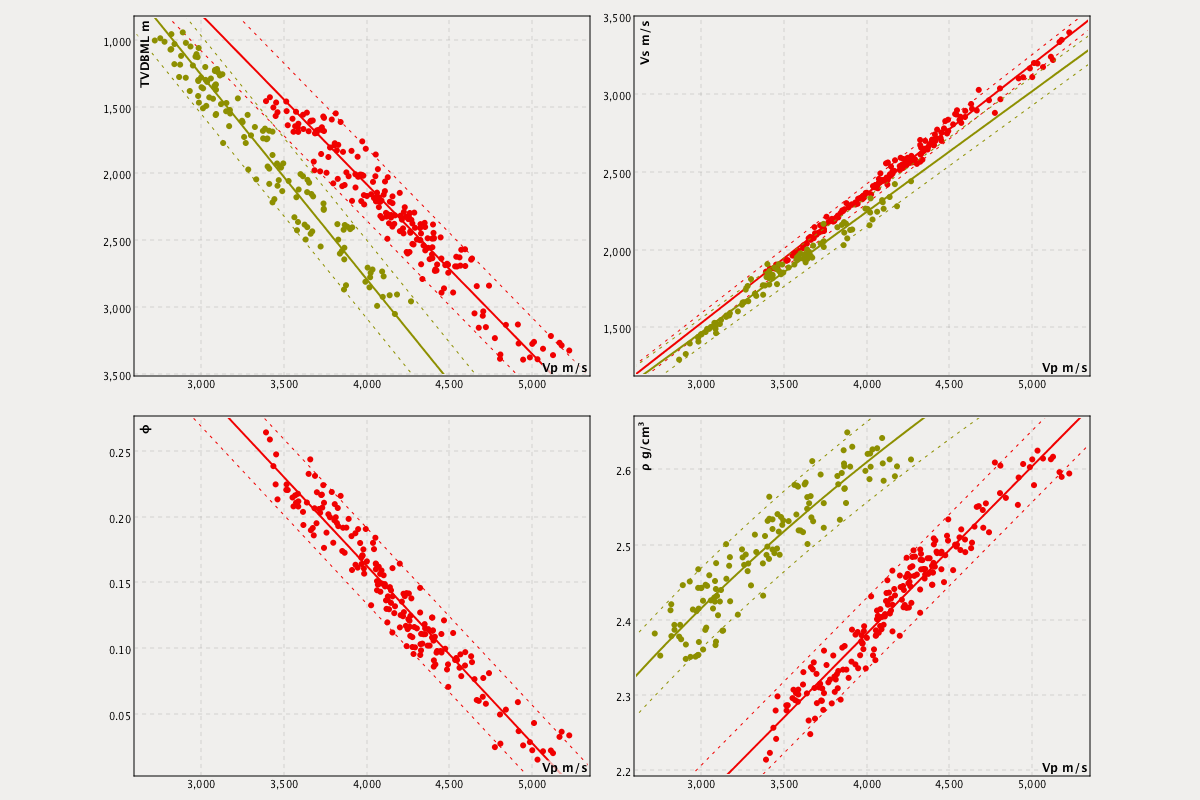
Depth dependent statistical rock physics model capturing the inherent scatter of elastic rock properties for end-member lithologies (sand in red and shale in green).
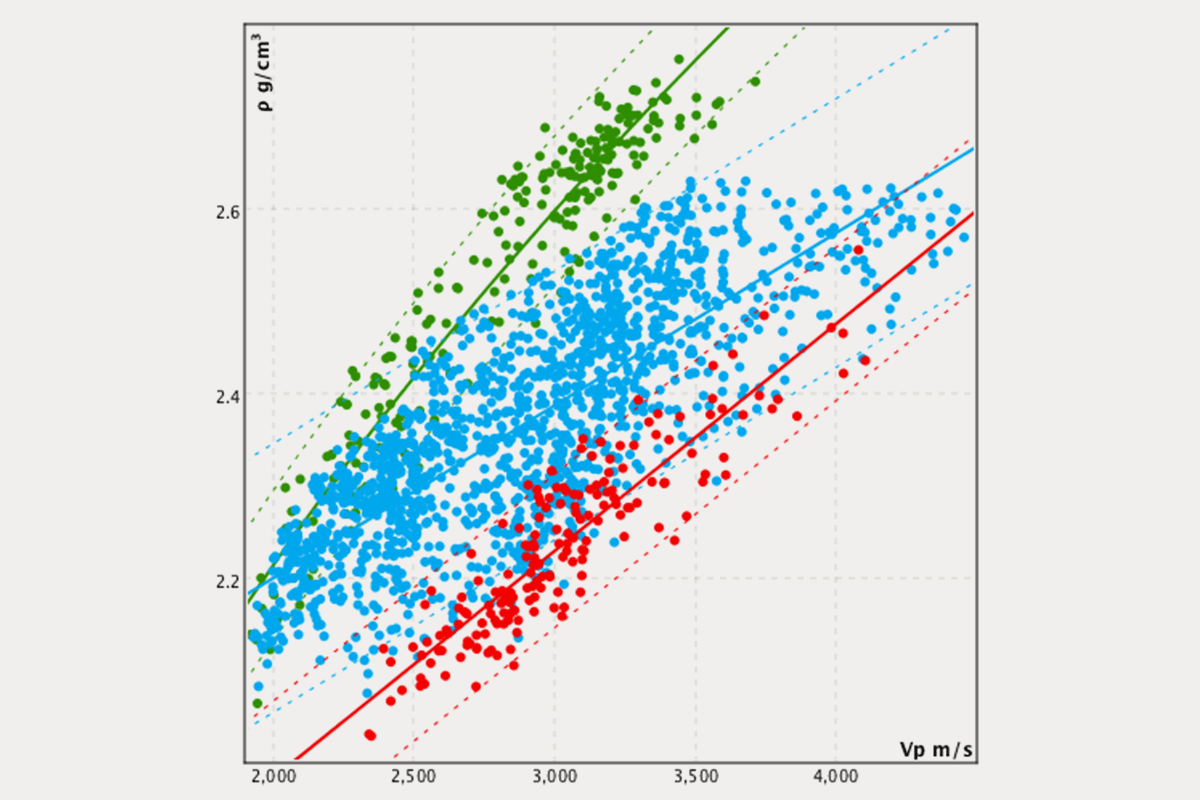
Comparison between end-member trending and the application of petrophysical cut-offs to quantify the inherent scatter of elastic properties. Interpreted end-member sand and shale picks are shown in red and green respectively. Sand picks using a VClay cut-off are shown in blue.
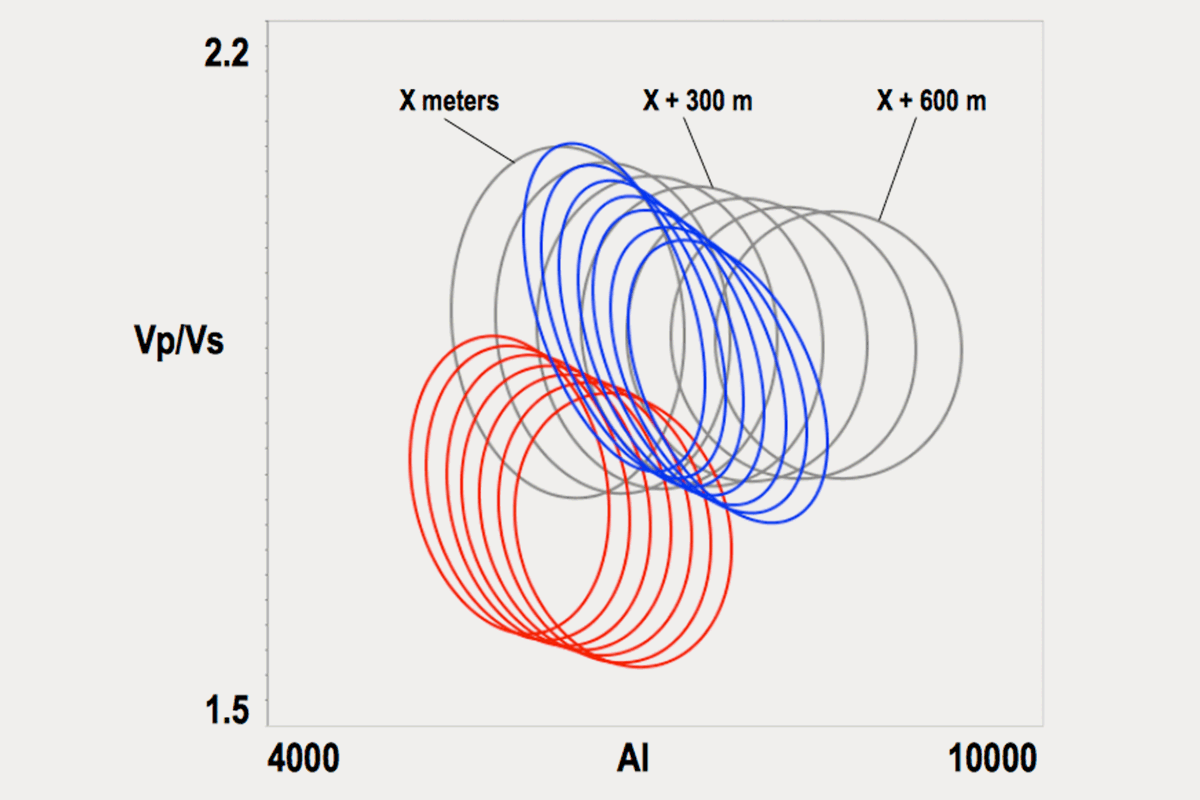
Stochastic forward modelling results over a 600 m depth range. Each ellipse represents the two standard deviation contour around the fitted PDF (from 10000 realisations) for the given lithology and fluid combination at a given depth. Red is a gas sand, blue is a brine sand and grey is a shale. Ellipses are shown at 100m depth increments. The ability to discriminate between different lithologies and fluid content can be interpreted.
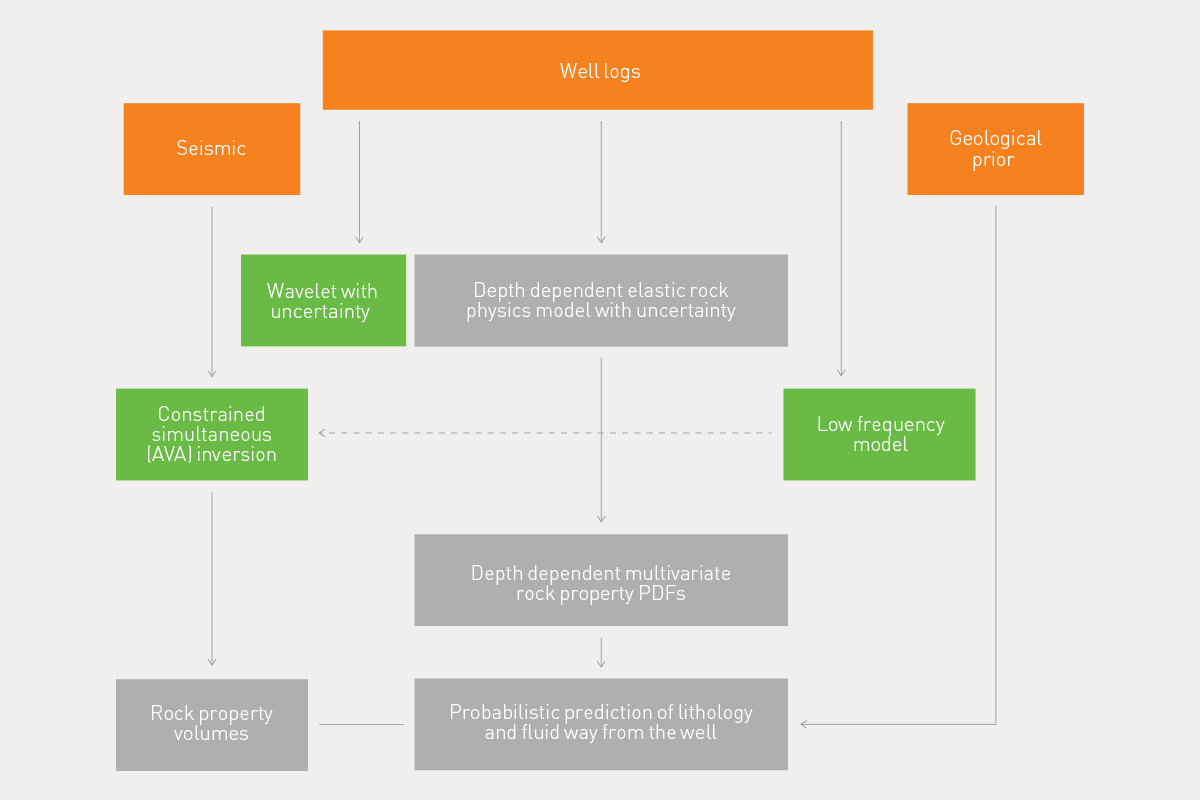
Seismic amplitude and rock property forward modelling is performed stochastically (Monte Carlo simulation), to capture the expected range of responses for all candidate lithology and fluid combinations over the depth range of interest.
DUG Spike® is a constrained simultaneous inversion toolkit that quantifies the elastic rock properties that result in the observed AVA present in seismic data.
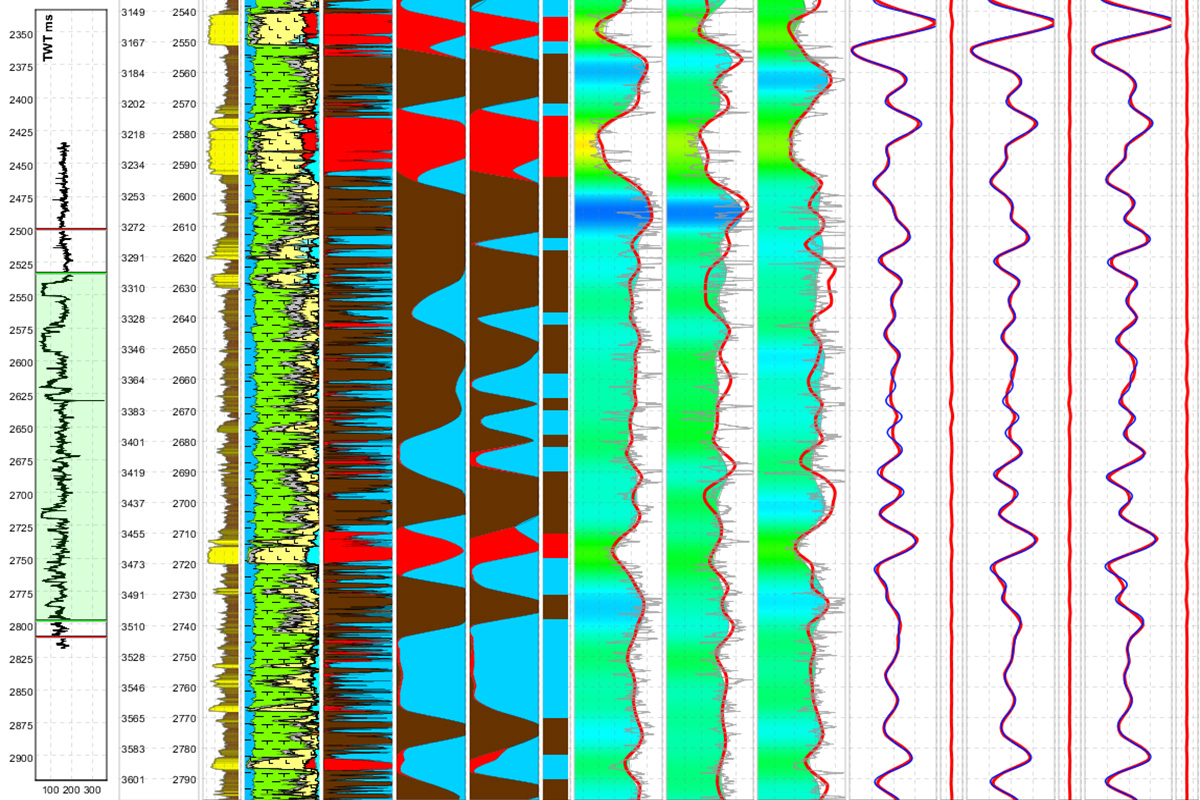
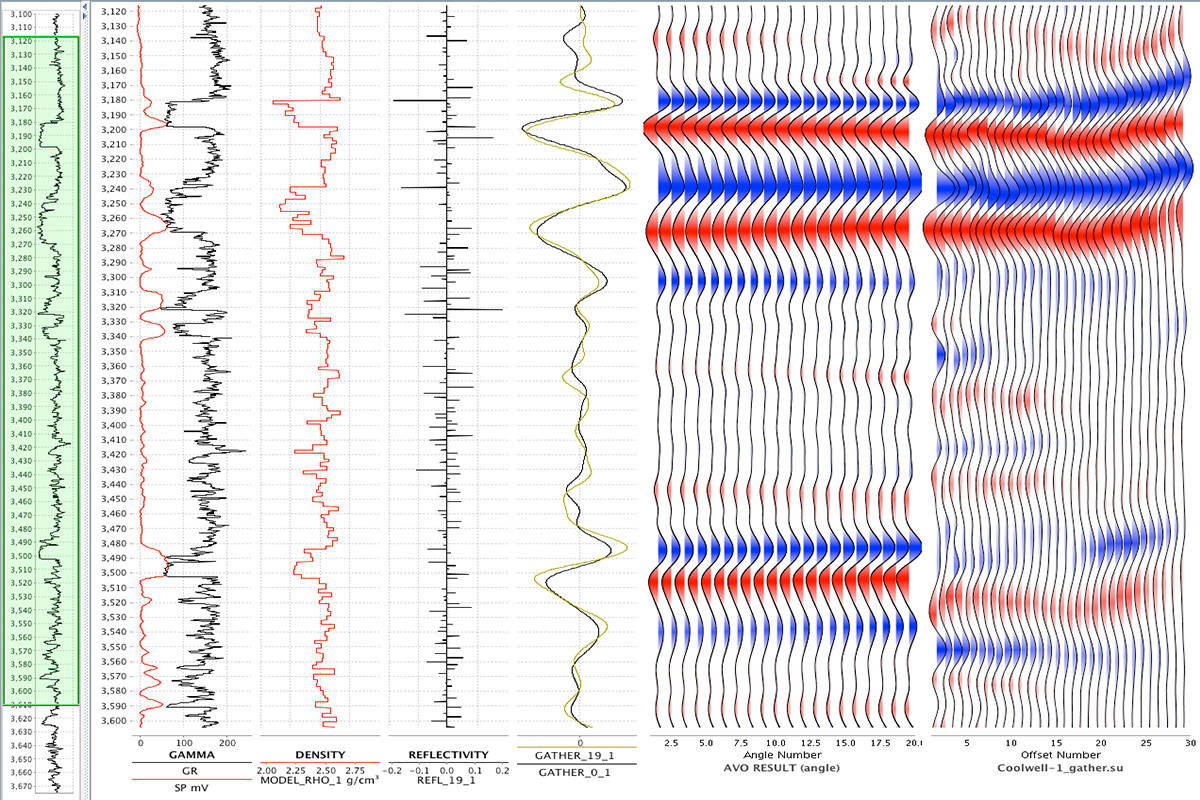
Example of the interactive calibration interface (at a well location) for simultaneous inversion and lithology and fluid prediction.
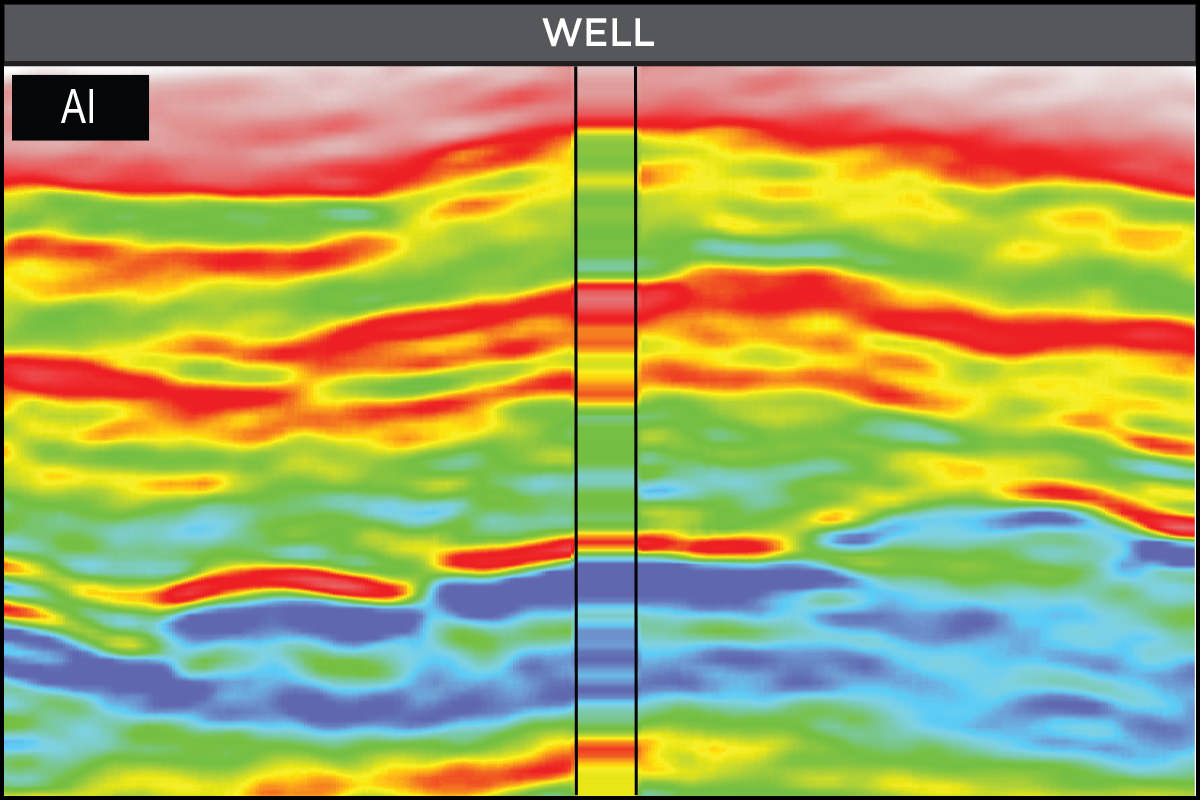
Absolute acoustic impedance (AI) tie at a well location after inversion.
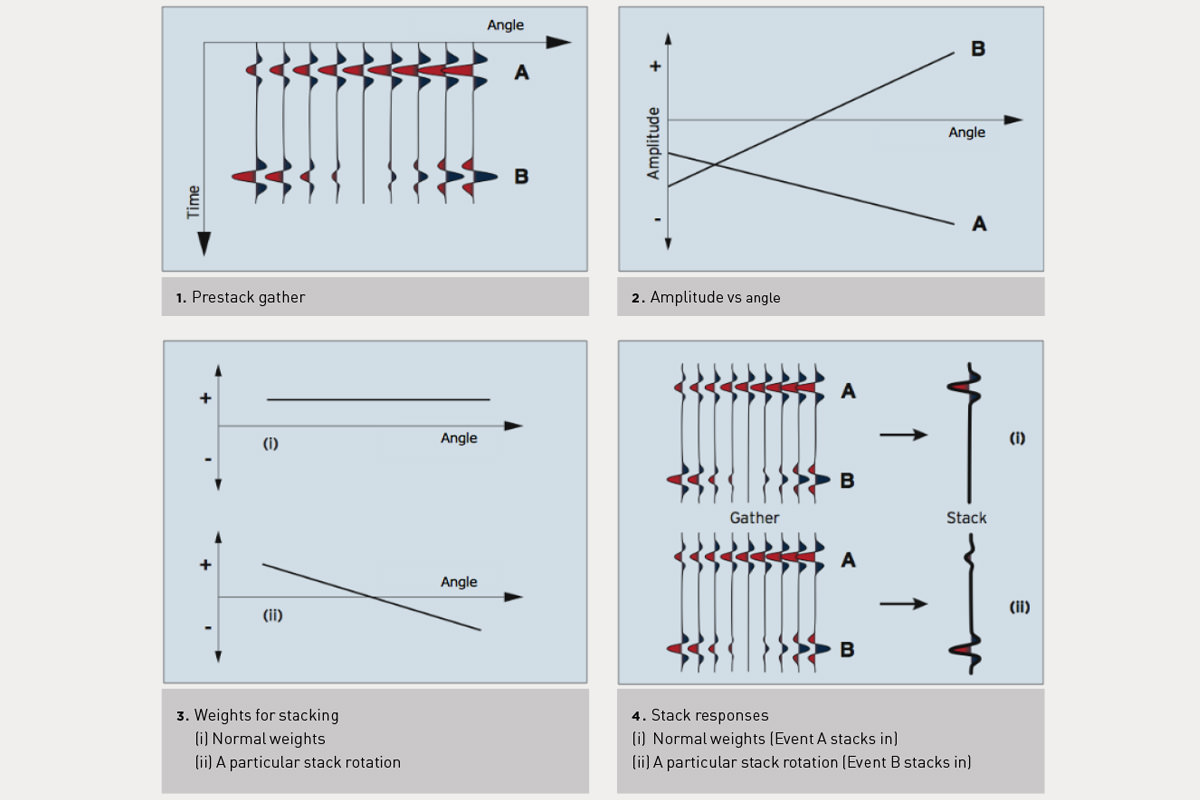
The concept of weighted stacking to enhance or suppress particular classes of AVA.
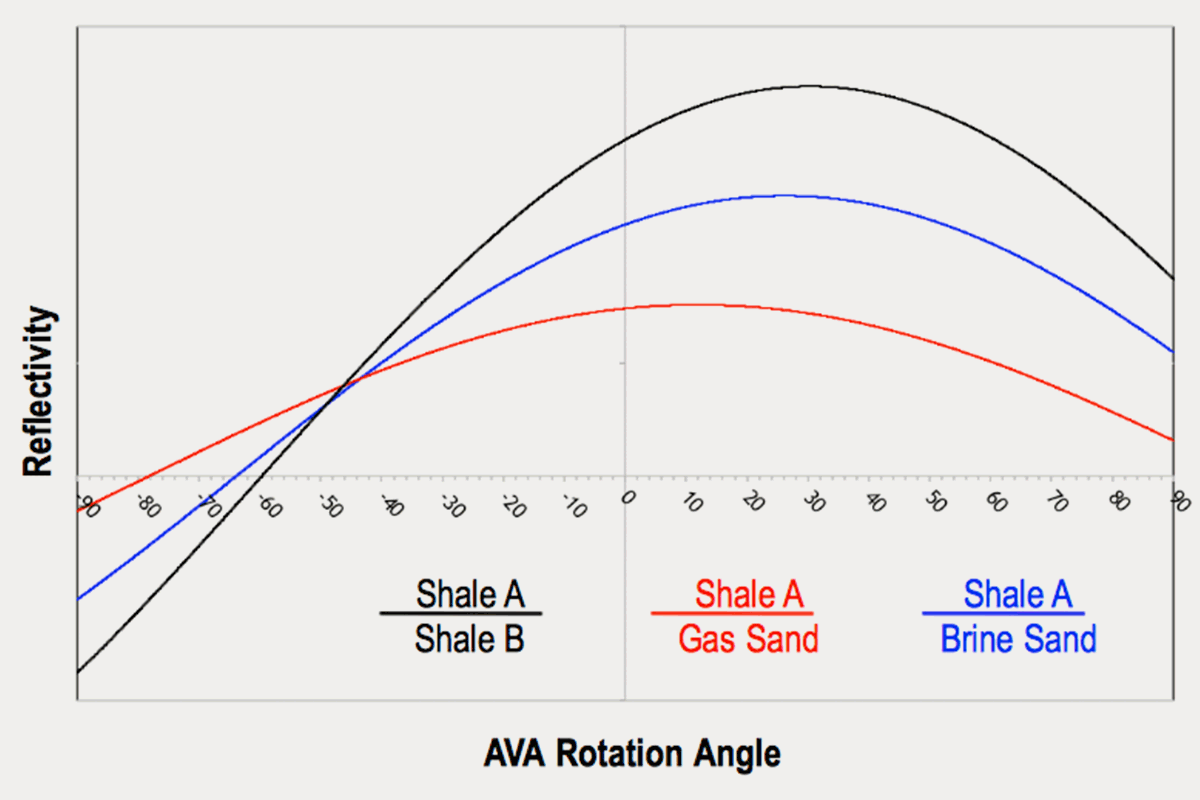
Variation in reflectivity as a function of AVA stack rotation angle for three different interface models. Notice in this case that at around -60 degrees the gas response is enhanced relative to the brine and shale responses.
AVA stack rotations are DUG’s equivalent to Extended Elastic Impedance (EEI) and are designed to help discriminate between different AVA responses.
Using derived petrophysical interpretations deterministic AVA synthetics can be calculated for different fluid scenarios.
Gassmann fluid substitution is used to generate elastic logs for the different fluid cases. Deterministic modelling provides an understanding of the variation in expected seismic response at the well locations for different fluid scenarios and can be compared to the population behaviour described by the stochastic modelling results.
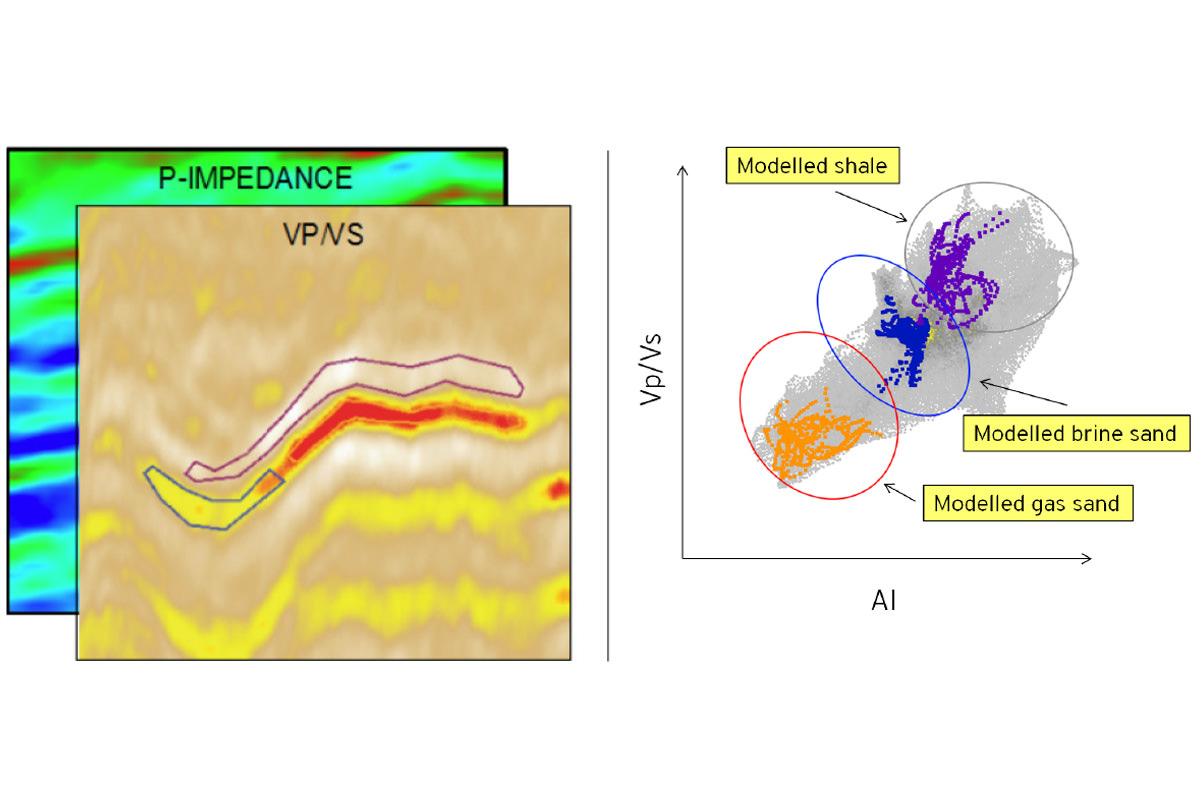
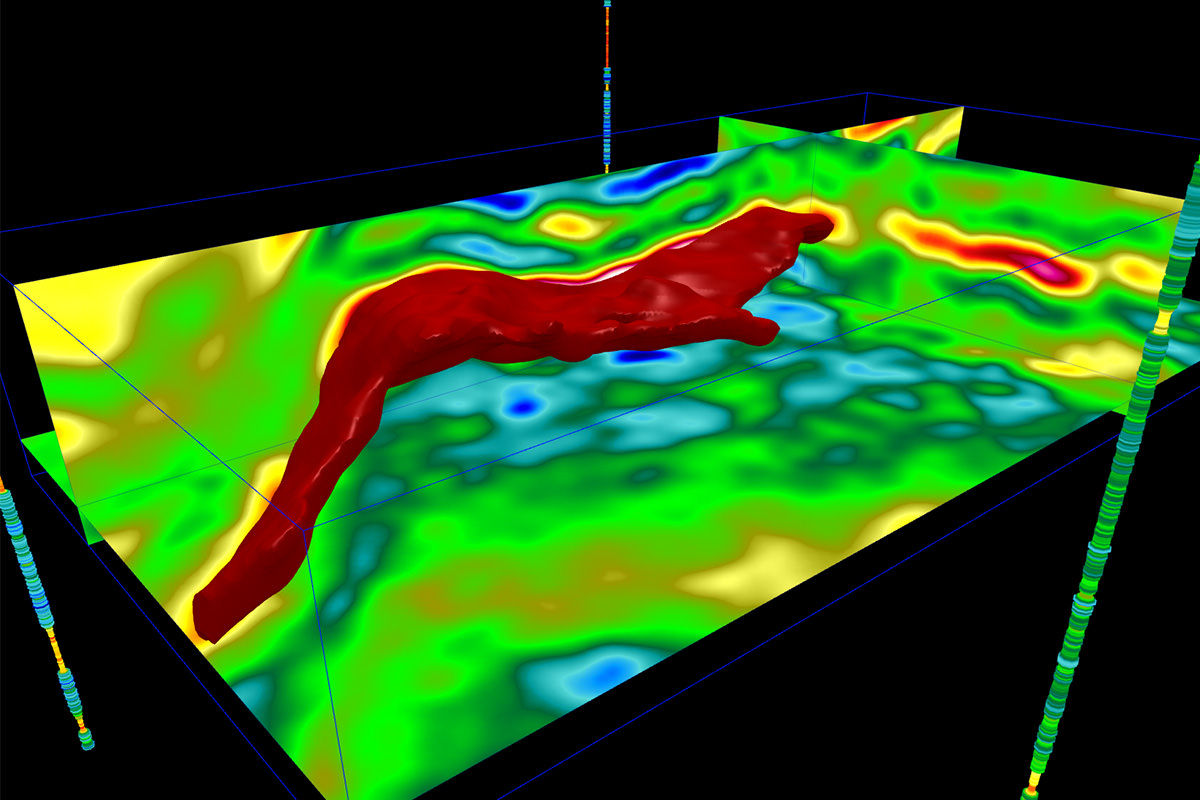
Qualitative comparison of the inverted rock properties with the modelled PDFs from the appropriate depth. The P-Impedance and Vp/Vs data shown in section on the left is crossplotted on the right. Three polygons have been drawn on the section and the corresponding points have been highlighted in their respective colours on the crossplot. The orange polygon captures an anomaly with low impedance and Vp/Vs. The blue polygon captures the down-dip part of this anomaly. The purple polygon captures the bounding lithology.
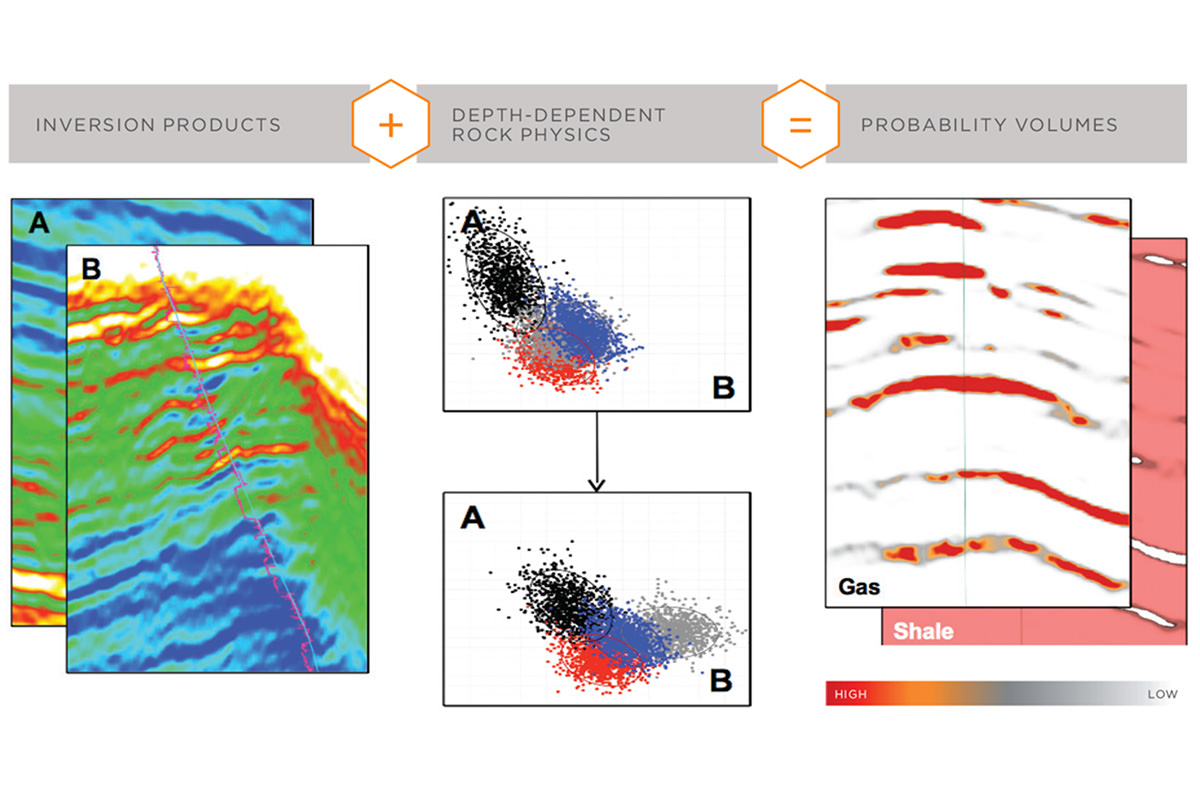
Each sample in the inverted rock property volumes can be quantitatively compared with the modelled PDFs (representing the possible lithology and fluid combinations) for the depth of that sample. Using a Bayesian classification scheme the probability of that sample being any one of the possible lithology and fluid combinations can be calculated. In this way lithology and fluid probability volumes can be calculated for the entire inversion volume.
The use of a Bayesian classification framework enables prior geological knowledge to be incorporated into a probabilistic prediction, capturing uncertainty and quantifying risk.