Build customised map overlays from table data using DUG Insight 5.1’s new Bubble Map feature.
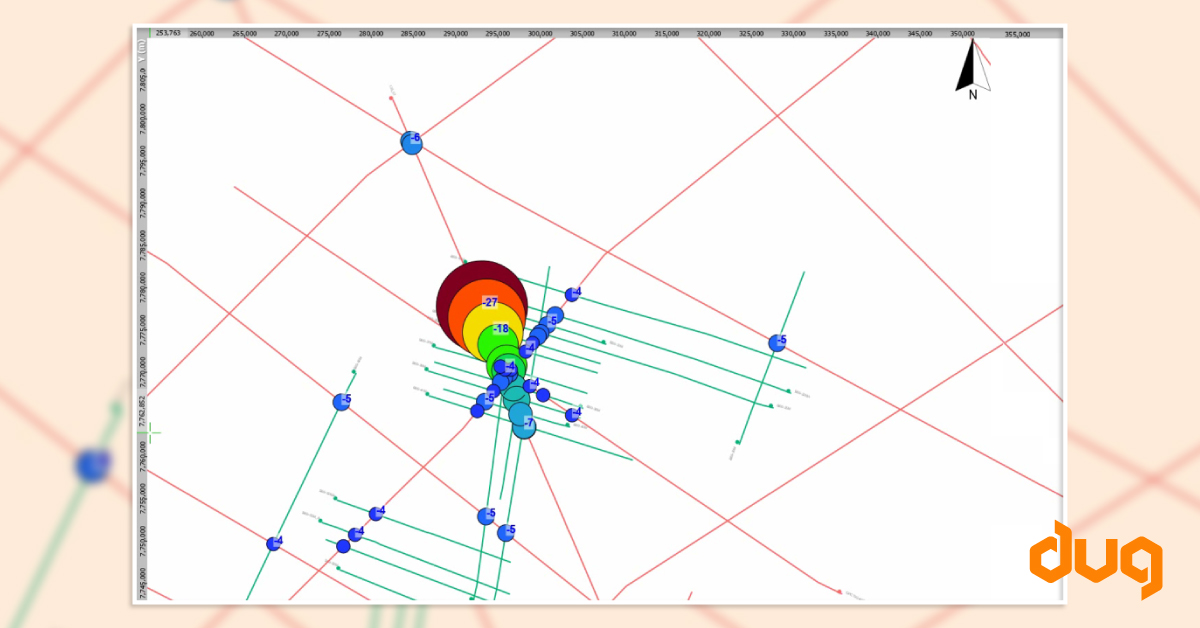
In part 2 of the Bubble Maps series, learn how to highlight areas of poor mistie between 2D lines and easily report these for correction.
Watch this 5-min video for the tips & tricks you need!