Quantitative interpretation requires true amplitudes and high signal-to-noise ratio.
DUG MP-FWI Imaging delivers superior pre-stack amplitude vs angle outputs for lithology and fluid prediction.
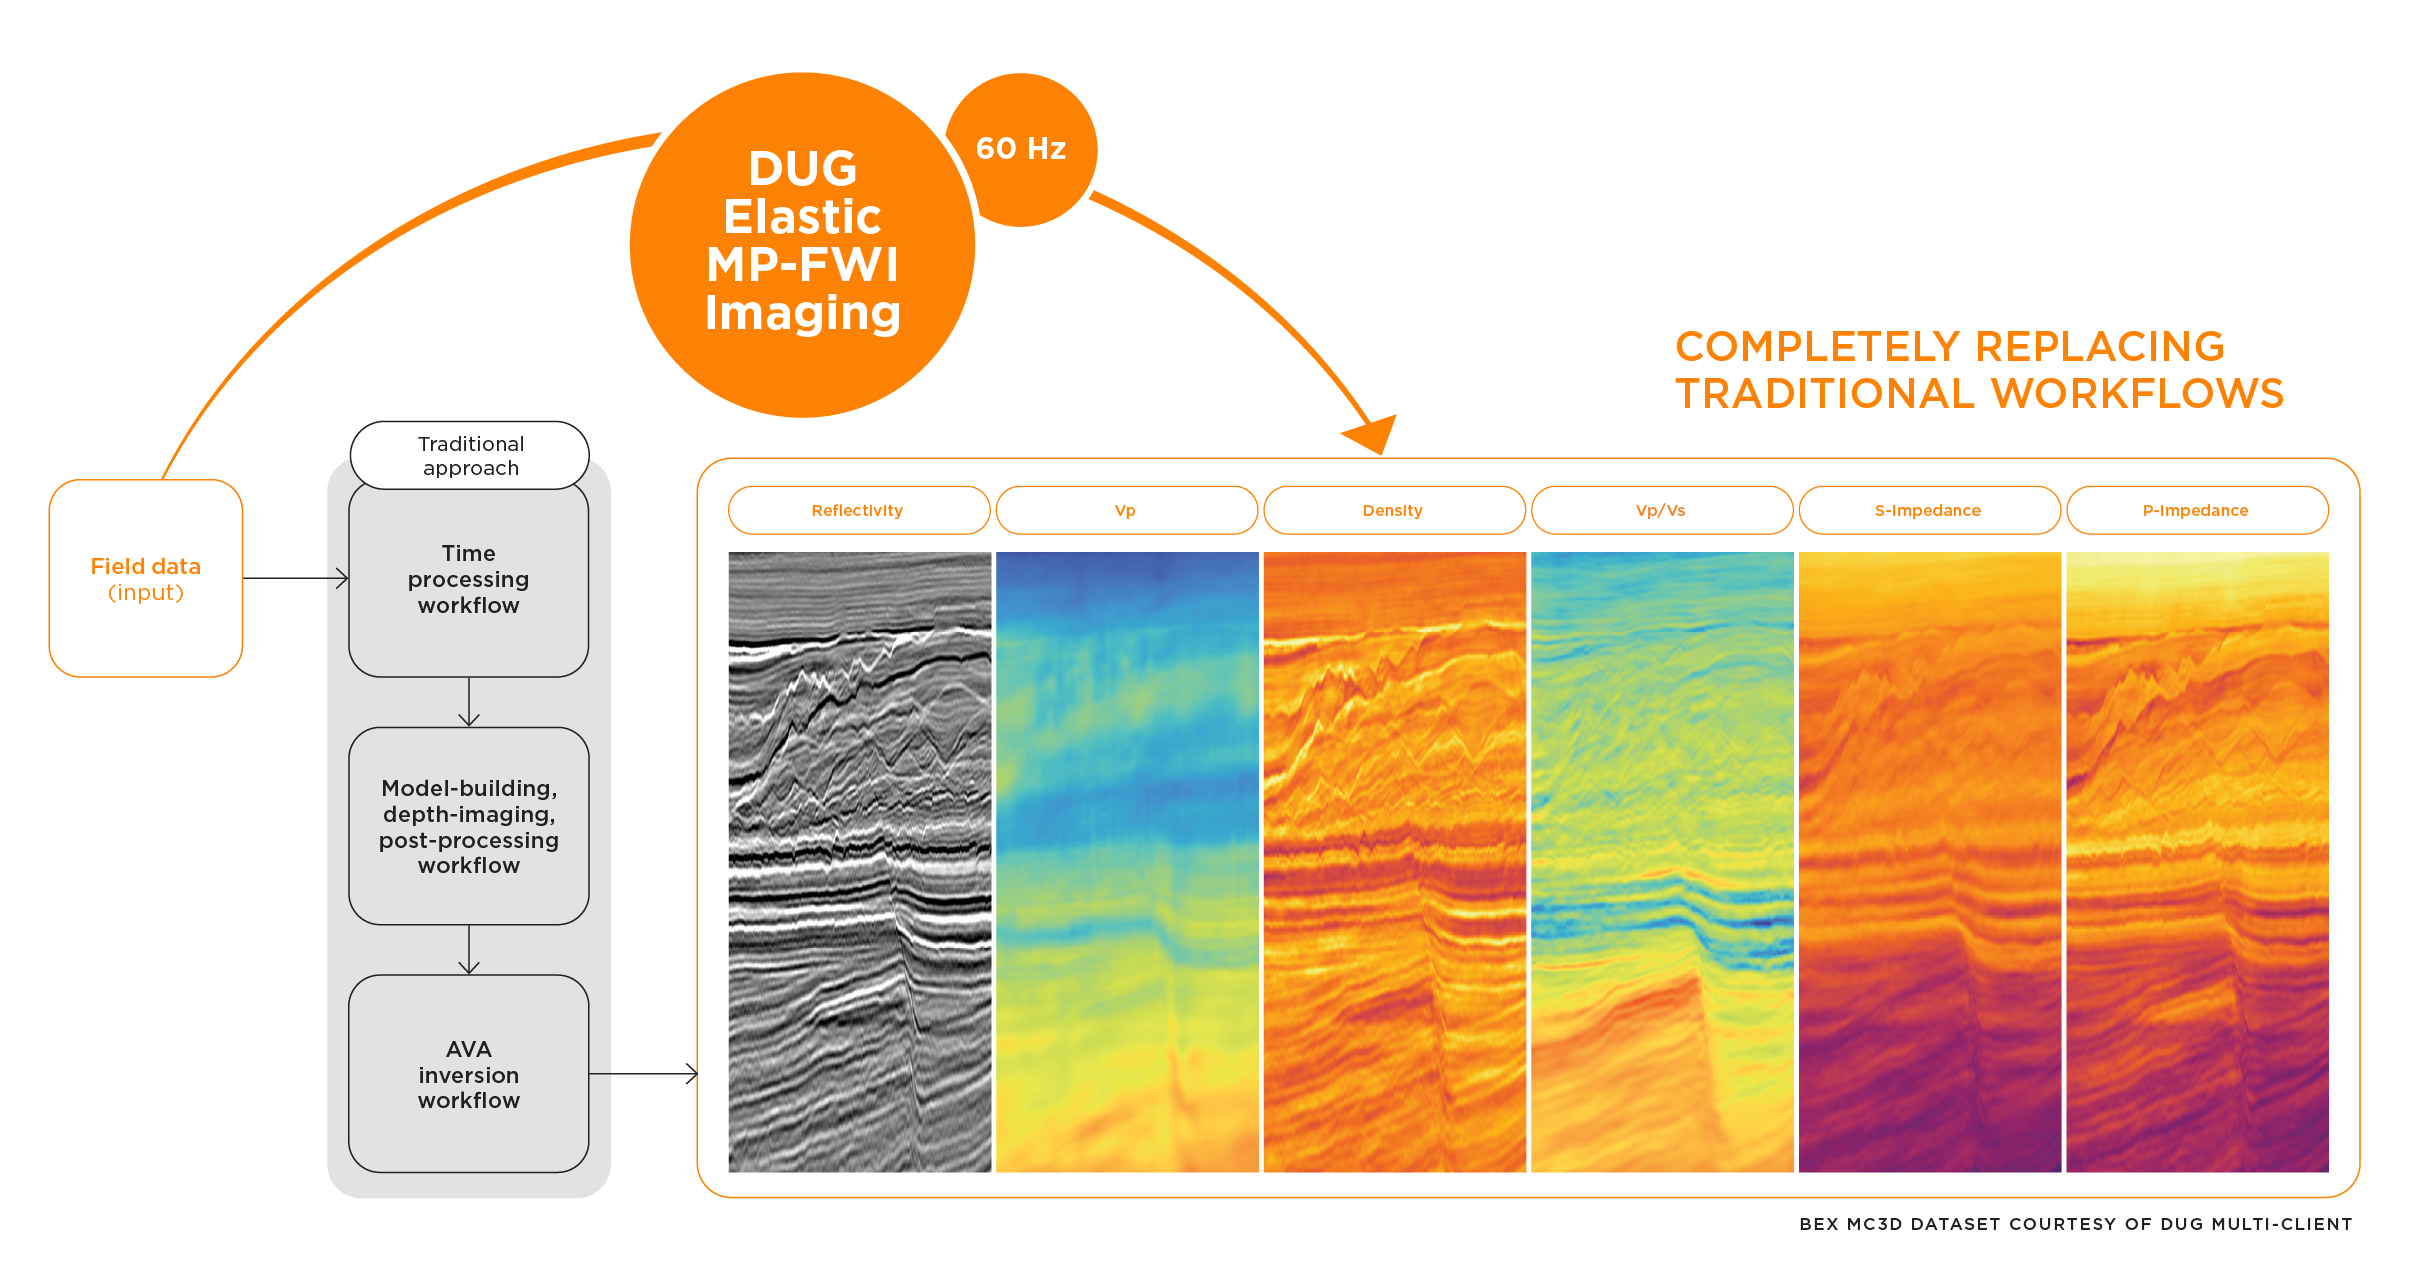
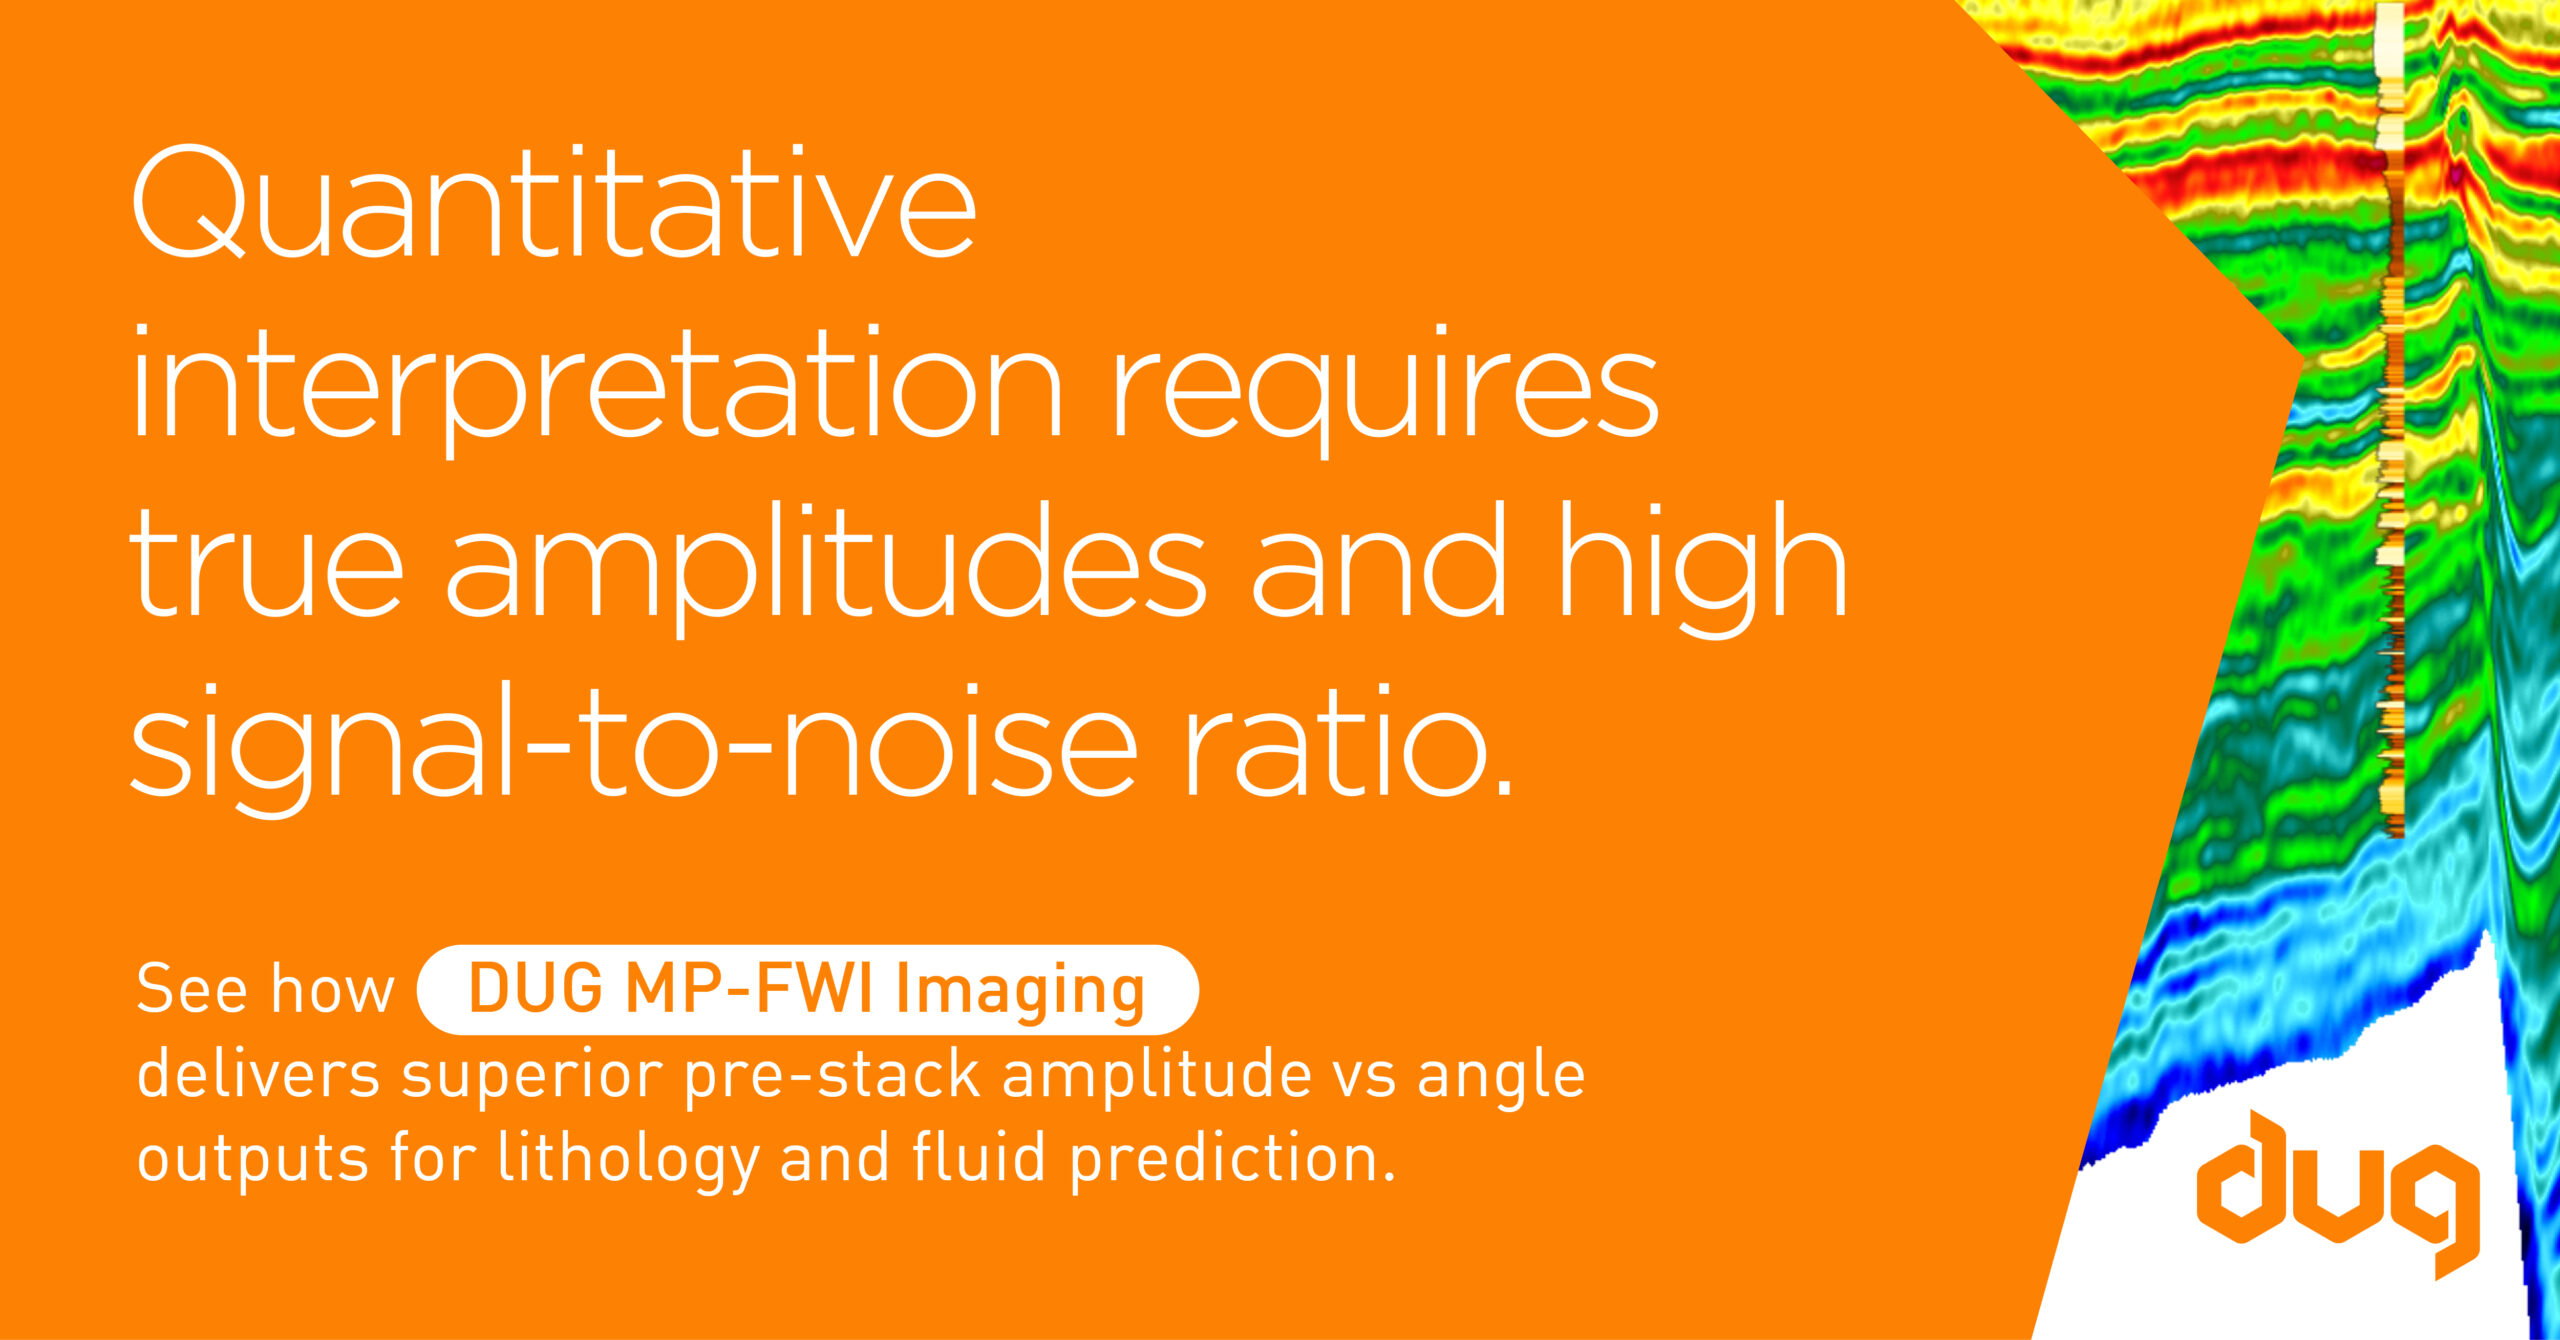
Let’s compare simultaneous AVA inversion results using pre-stack reflectivity inputs from two different workflows.
Firstly, here is P-impedance. (Warmer colours represent lower values.)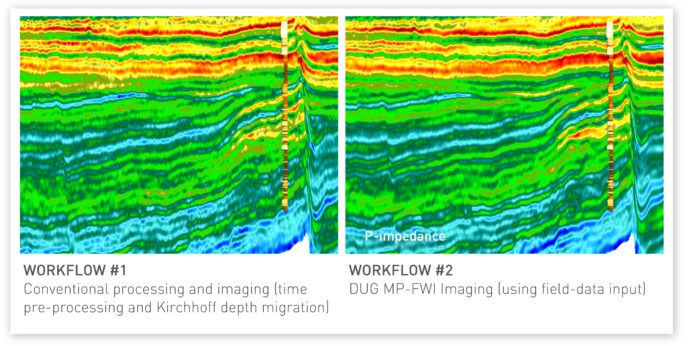
Secondly, here is Vp/Vs ratio. (Warmer colours represent lower values.)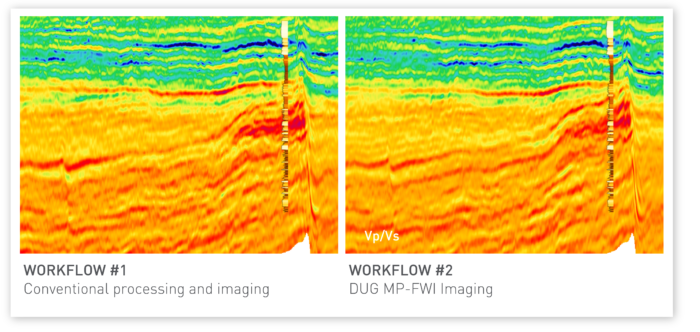
And finally here is gas probability after fluid and lithology production using a Bayesian classification framework. (Higher probability is shown in red.)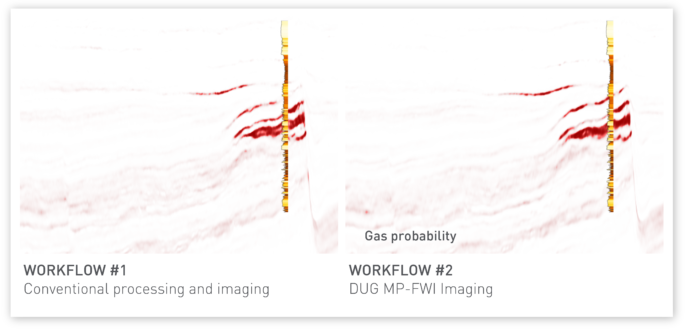 Qualitatively the results are very similar—but note the vastly different workflows to get to each result!
Let’s take a closer look.
Here we compare crossplots (prepared in exactly the same way) for each respective set of inverted rock properties. PDFs of modelled fluid and lithology combinations are also depicted.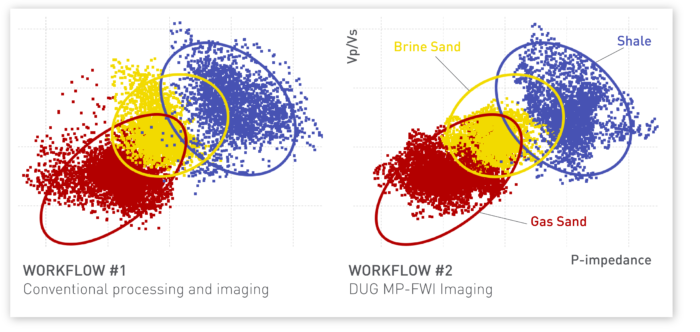
Note the MP-FWI results have produced less scatter (or higher signal-to-noise ratio) which translates to less uncertainty!
DUG MP-FWI Imaging is a complete replacement for the conventional processing and imaging workflow.
Let’s talk—contact us today!
BEX MC3D data courtesy of Multi-Client Resources