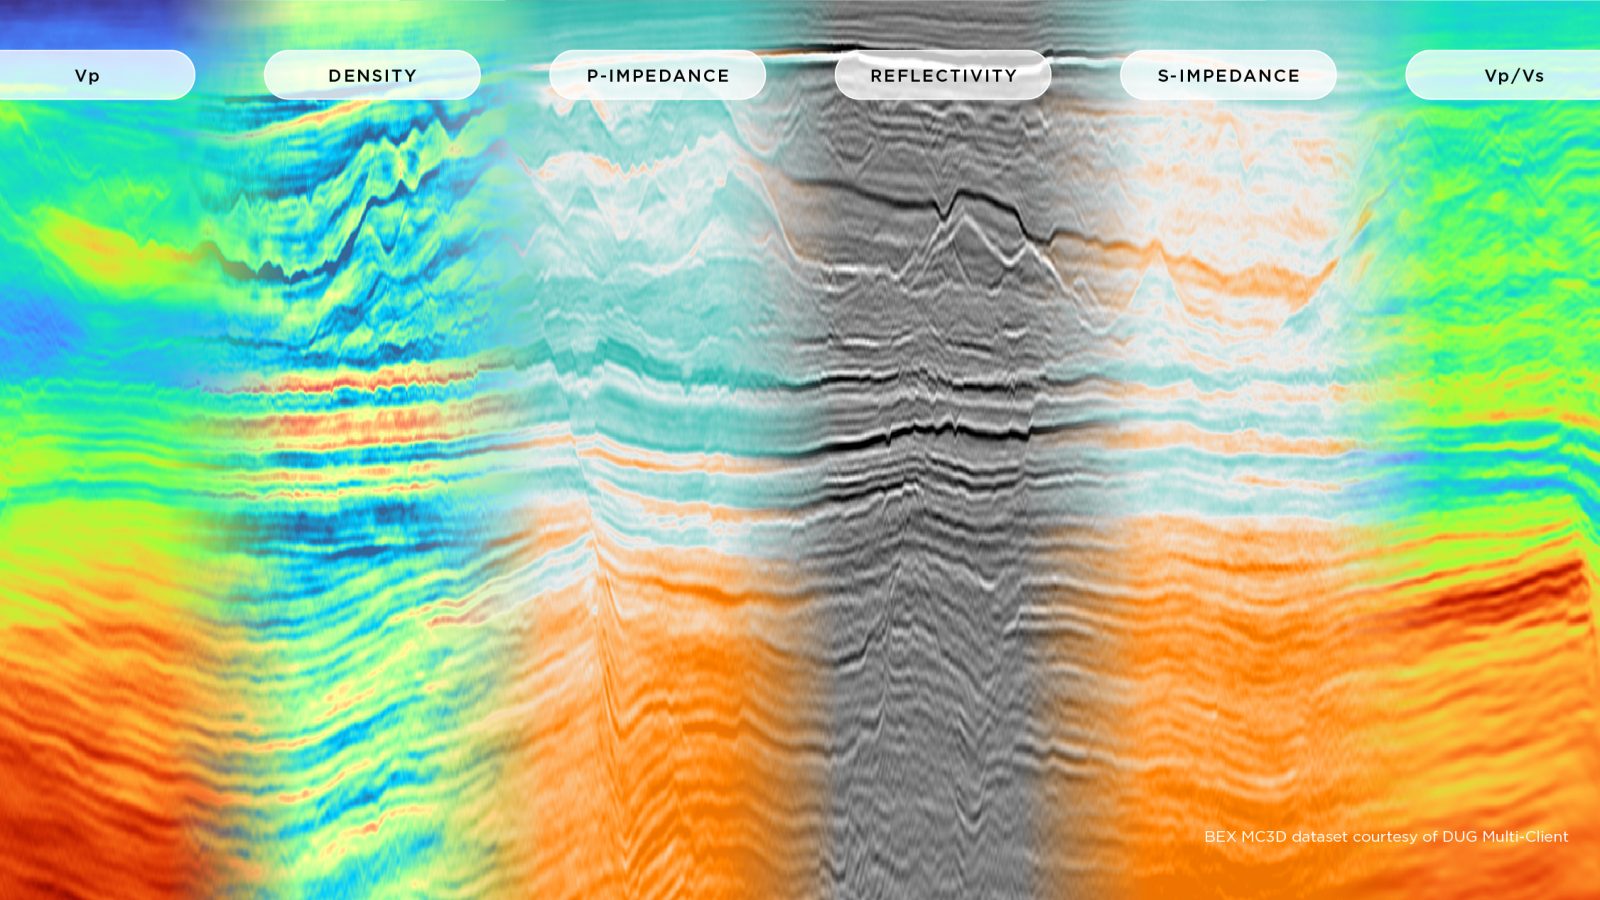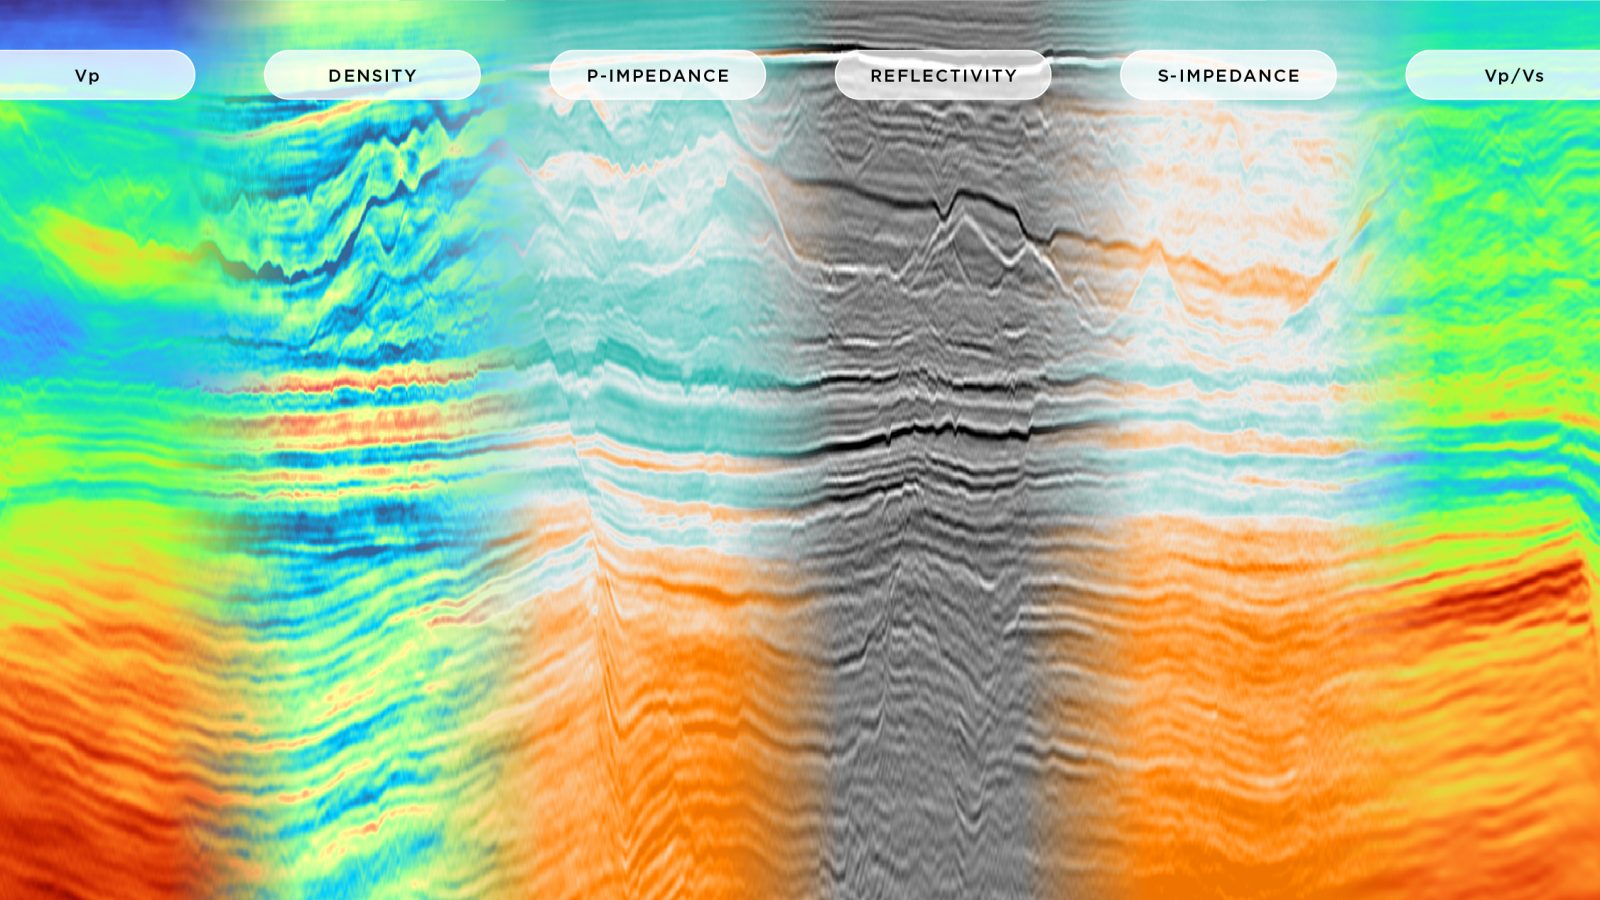

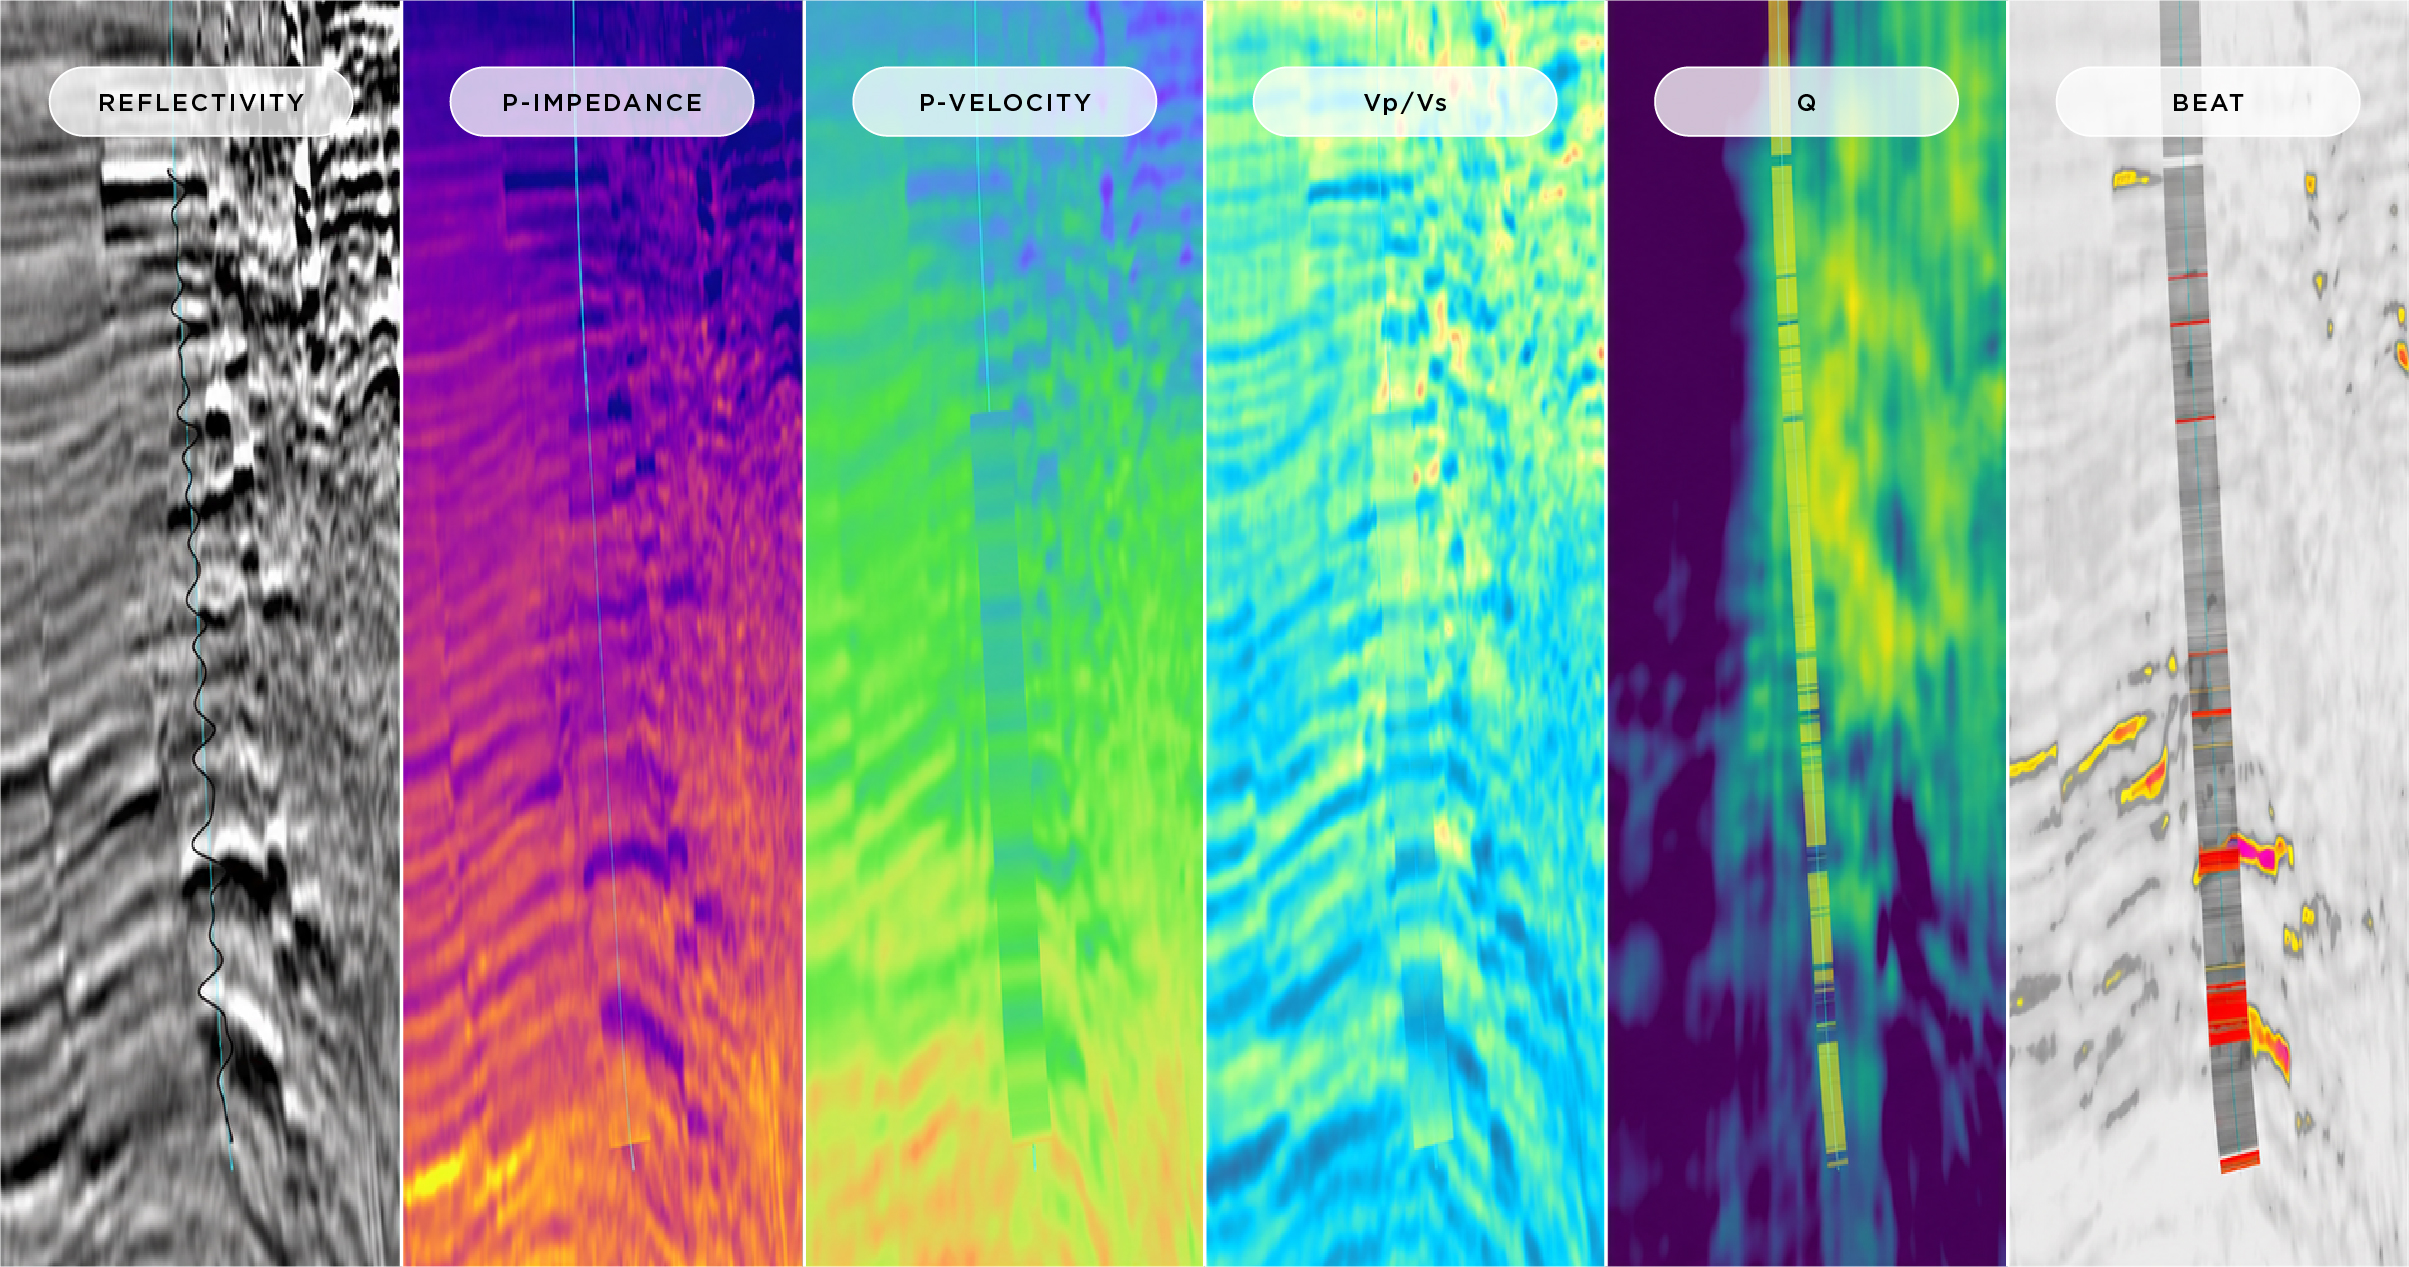
Image above: A common section through reflectivity, P-impedance, P-velocity, Vp/Vs, Q and the Blended Elastic ATtribute (BEAT), with synthetic or well-log overlays. The panels bring geological structure, elastic contrasts, attenuation and the combined response of the gas-bearing intervals into one view.
This case study by DUG illustrates how elastic multi-parameter full-waveform inversion is giving geoscientists a clearer picture of gas reservoirs in complex offshore settings.
Characterising a gas-bearing sand takes a whole lot more than just spotting a bright seismic amplitude anomaly. Understanding the elastic response, tying back to well data, and making sure the anomaly conforms to structure are all part of the story. Throw in shallow gas pockets, heavy attenuation, and complex fault networks—like the ones in Trinidad and Tobago’s Columbus Basin—and you’ve got a real challenge on your hands.
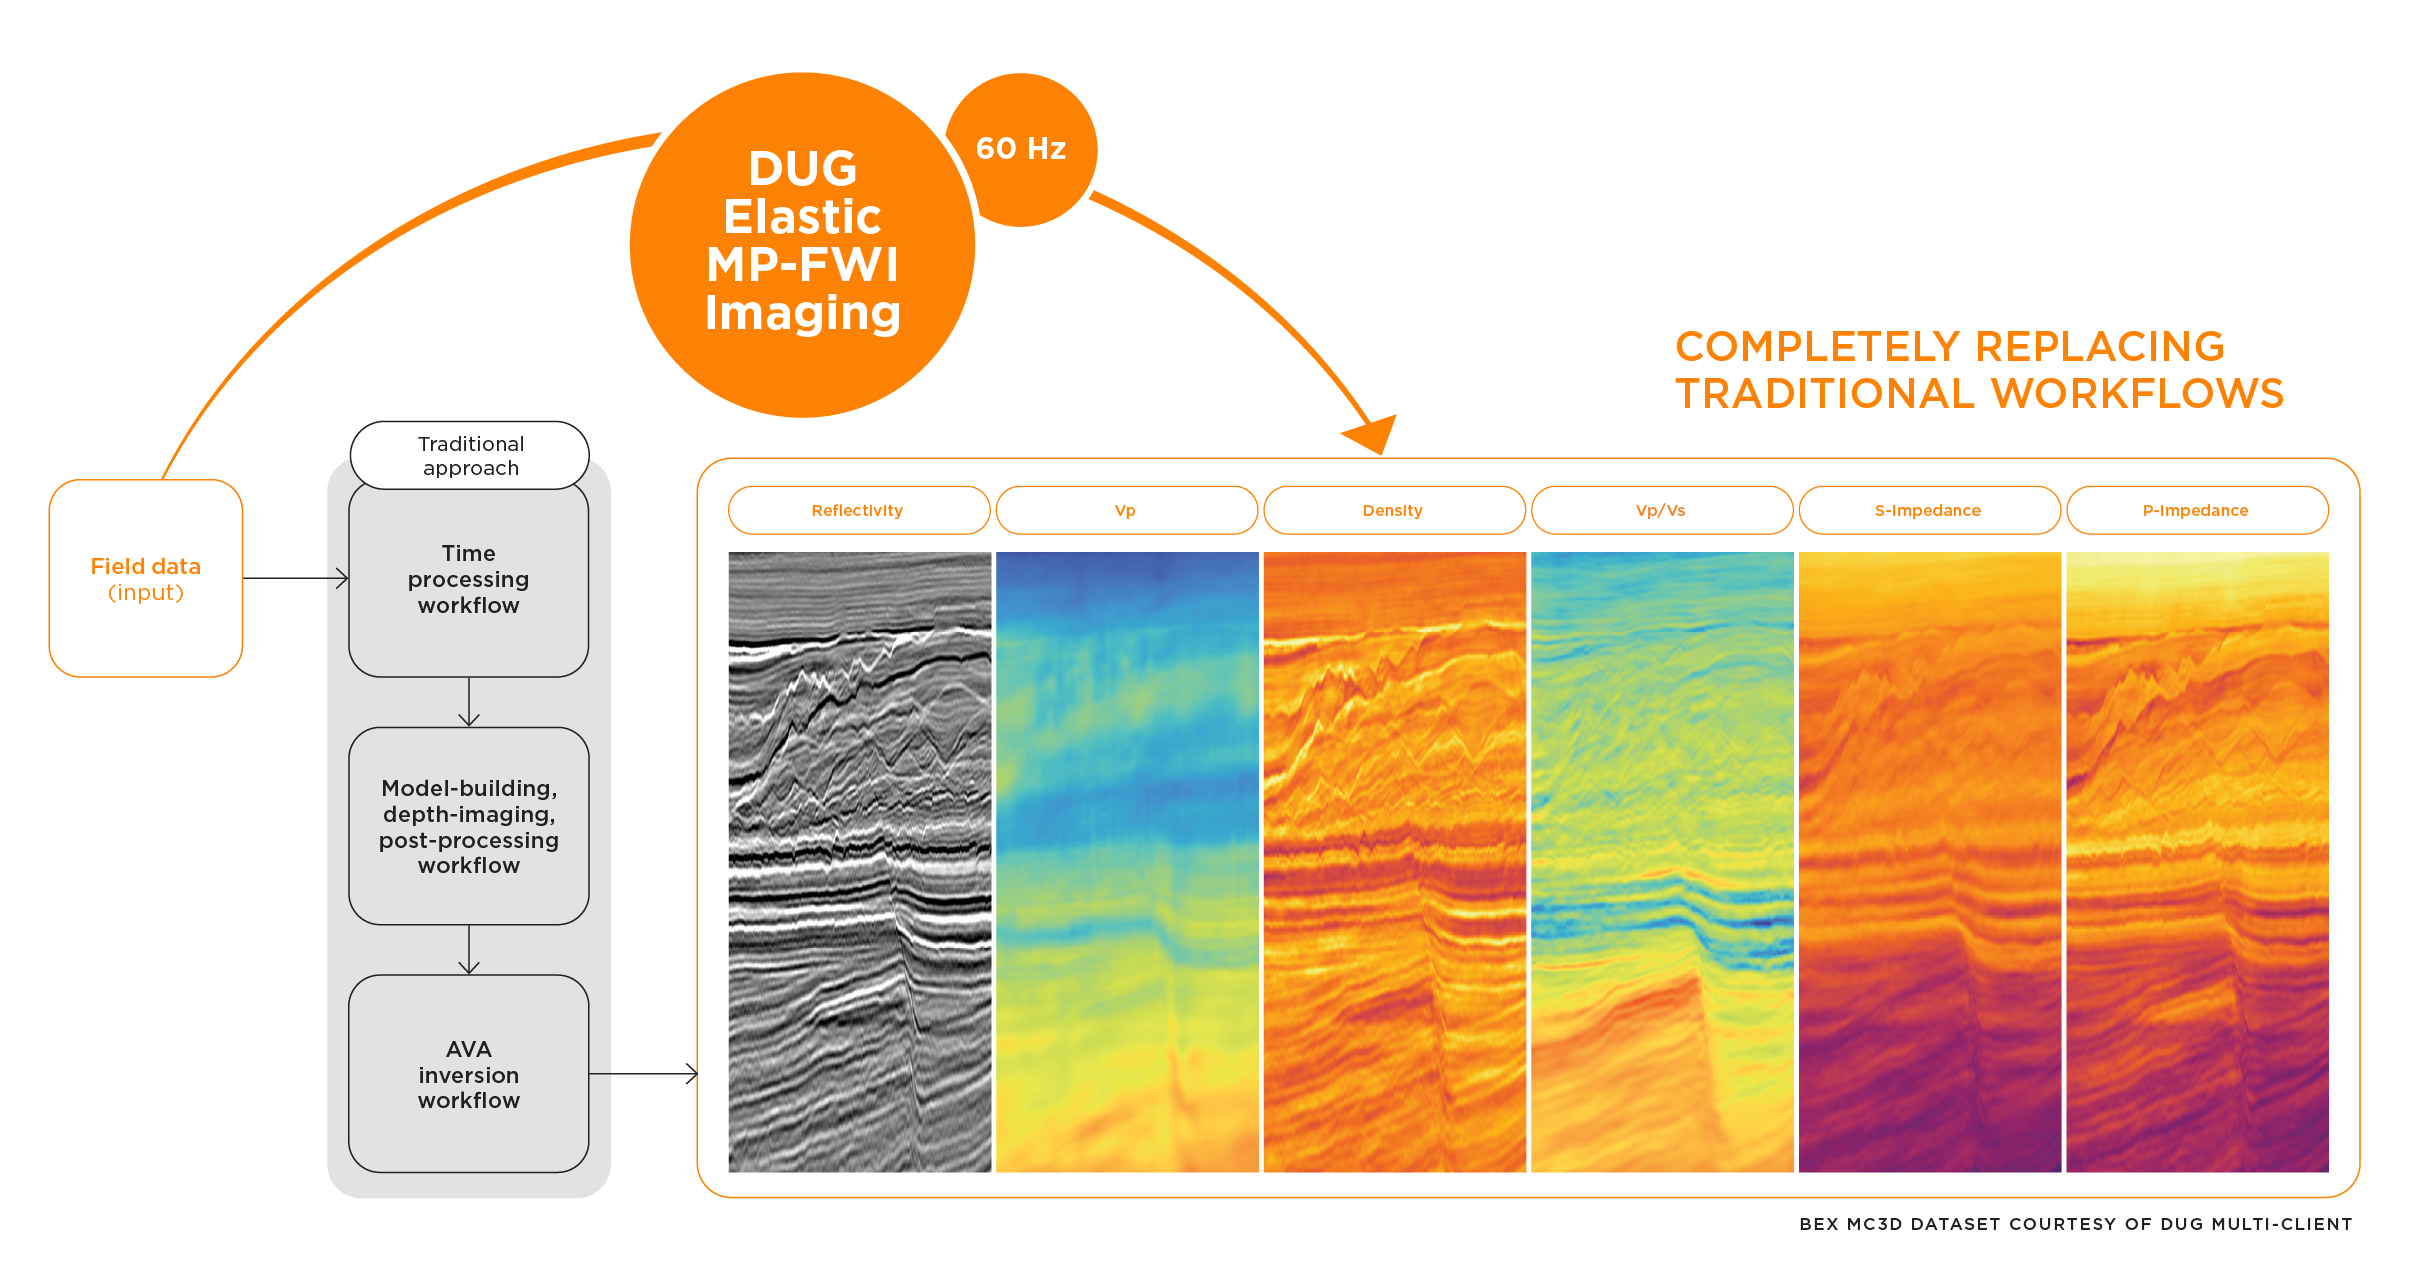
That’s where multi-parameter full-waveform inversion (MP-FWI) steps in. Instead of treating FWI as just a tool for building velocity models, the team at DUG Technology shows how viscoelastic MP-FWI can extend right into reservoir characterisation. By jointly inverting for P-velocity, P-impedance, and Vp/Vs—and bringing Q (attenuation) into the final update—the approach pulls structural imaging and elastic properties together into one unified workflow.
Why the Columbus Basin keeps geophysicists on their toes
The Columbus Basin packs a lot of geology into one place: thick Plio-Pleistocene sediments supplied by the proto-Orinoco river system, crossed by transpressional folds, strike-slip faults, and gravity-driven normal faults. This creates a complex system of fault-bounded reservoir compartments. In an area like this, you can’t rely on a single low-impedance anomaly to identify gas, because shaly brine sands can look deceptively similar.
To tackle this, DUG worked with a 2012 ocean-bottom-cable (OBC) survey in 50–80 metres of water. They ran viscoelastic MP-FWI through increasing frequency bands up to 30 Hz, updating anisotropy and Q along the way. Crucially, the process uses the full wavefield—including multiples of all orders. Because multiples bounce around and illuminate areas standard primary reflections miss, they help fill imaging gaps and wipe out acquisition footprint issues caused by sparse OBC receiver layouts.
Comparing inverted properties directly to the wells
With a structural framework in place from the inverted reflectivity, the next step was checking how effectively the inverted properties matched up with known well logs. Since the well data wasn’t used to constrain the inversion directly (only to build smooth background starting models), comparing them provided an independent quality check.
The results showed an impressively good match. Coinciding low values in P-velocity, P-impedance, and Vp/Vs aligned with the gas sands flagged by gamma ray and resistivity logs.
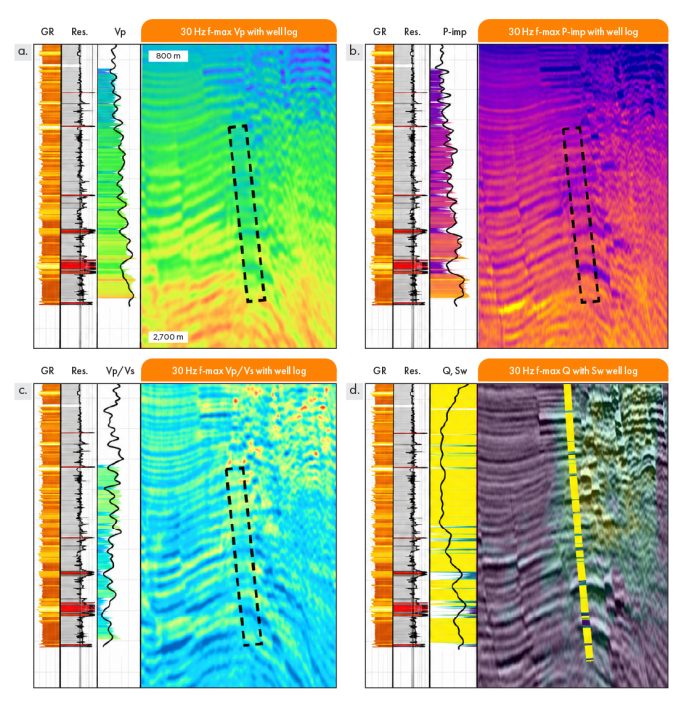
Well and section comparisons: (a) P-velocity; (b) P-impedance; (c) Vp/Vs; and (d) Q with the water-saturation log. Gamma ray and resistivity provide reservoir context, and well logs are overlaid on the sections. Panel (d) compares Q with water saturation.
Another interesting takeaway came from Q (attenuation). Lower Q values turned up in shallower, water-saturated gas sands, while higher Q sat in deeper gas sands, hinting that attenuation could give us extra clues about fluid saturation when combined with standard elastic properties.
Meet BEAT: Blending attributes for clearer insights
To make all these parameters easier to interpret at once, the team experimented with RGB blending—mapping P-velocity to blue, P-impedance to red, and Vp/Vs to green. Where all three properties dropped together, the colours merged into bright white highlights over known gas intervals.
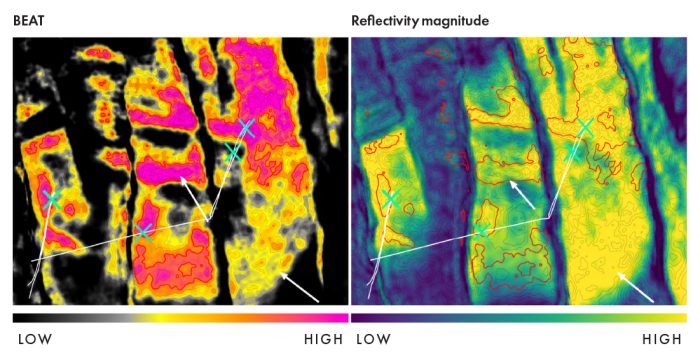
Building on that idea, DUG created the Blended Elastic ATtribute (BEAT). BEAT combines detrended, normalised versions of P-velocity, P-impedance, Vp/Vs, and Q into a single volume that highlights local elastic changes. When compared against reflectivity magnitude horizon maps, BEAT told a complementary story: while reflectivity tracks interface contrast between layers, BEAT describes the overall internal elastic character of the interval itself.
This means that while a large contrast might show up bright on a reflectivity map, a true gas-bearing interval with distinct combined properties shines brightest on BEAT displays. Its local differences from reflectivity magnitude provided a complementary view for characterising gas-bearing intervals and tracing their spatial distribution.
DUG is extending this work to even higher resolution. Higher-frequency inversion would allow investigation of finer-scale variations in thin intervals. A dedicated statistical rock-physics analysis would then be a natural next step to quantify the relationships between the inverted elastic parameters, lithology and fluid content.
For more information check out this paper.